Problem 12-51 |
Finding the order of a reaction:
The dataset in this table is the original dataset that has been modified to show how the concentration of a species (reactant) changes over time for different reaction orders.
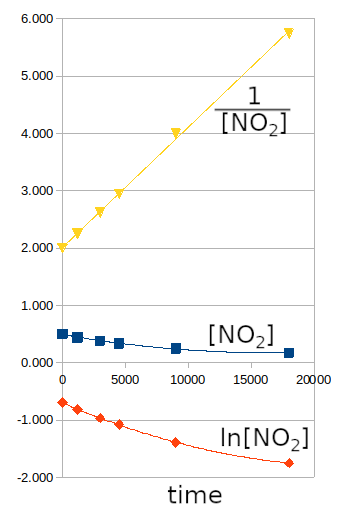
If these data are presented graphically, it is possible to determine the order of the reaction, based on [NO2], according to the integrated rate law:
|

|
- [NO2] vs time = linear : order zero
- Ln [NO2] vs time = linear : order one
- 1/[NO2] vs time = linear : order two
From these graphs, the linear trend is obtained for 1/[NO2] as a function of time, indicating that it is a second-order reaction.
This question may require the use of Excel.
It can also be solved by performing a linear regression analysis with your calculator.
Because this question is time-consuming, it is rarely asked in exams.
However, the three graphs can be presented to the student to identify the rate law of the reaction (see question 12-57).