RATE LAW / ACTIVATION ENERGY Lab Report Guideline
This lab report combines the results of two experiments.
The rate law
The first page should contain the following information:
- Name
- Date the experiment was performed
- Lab section
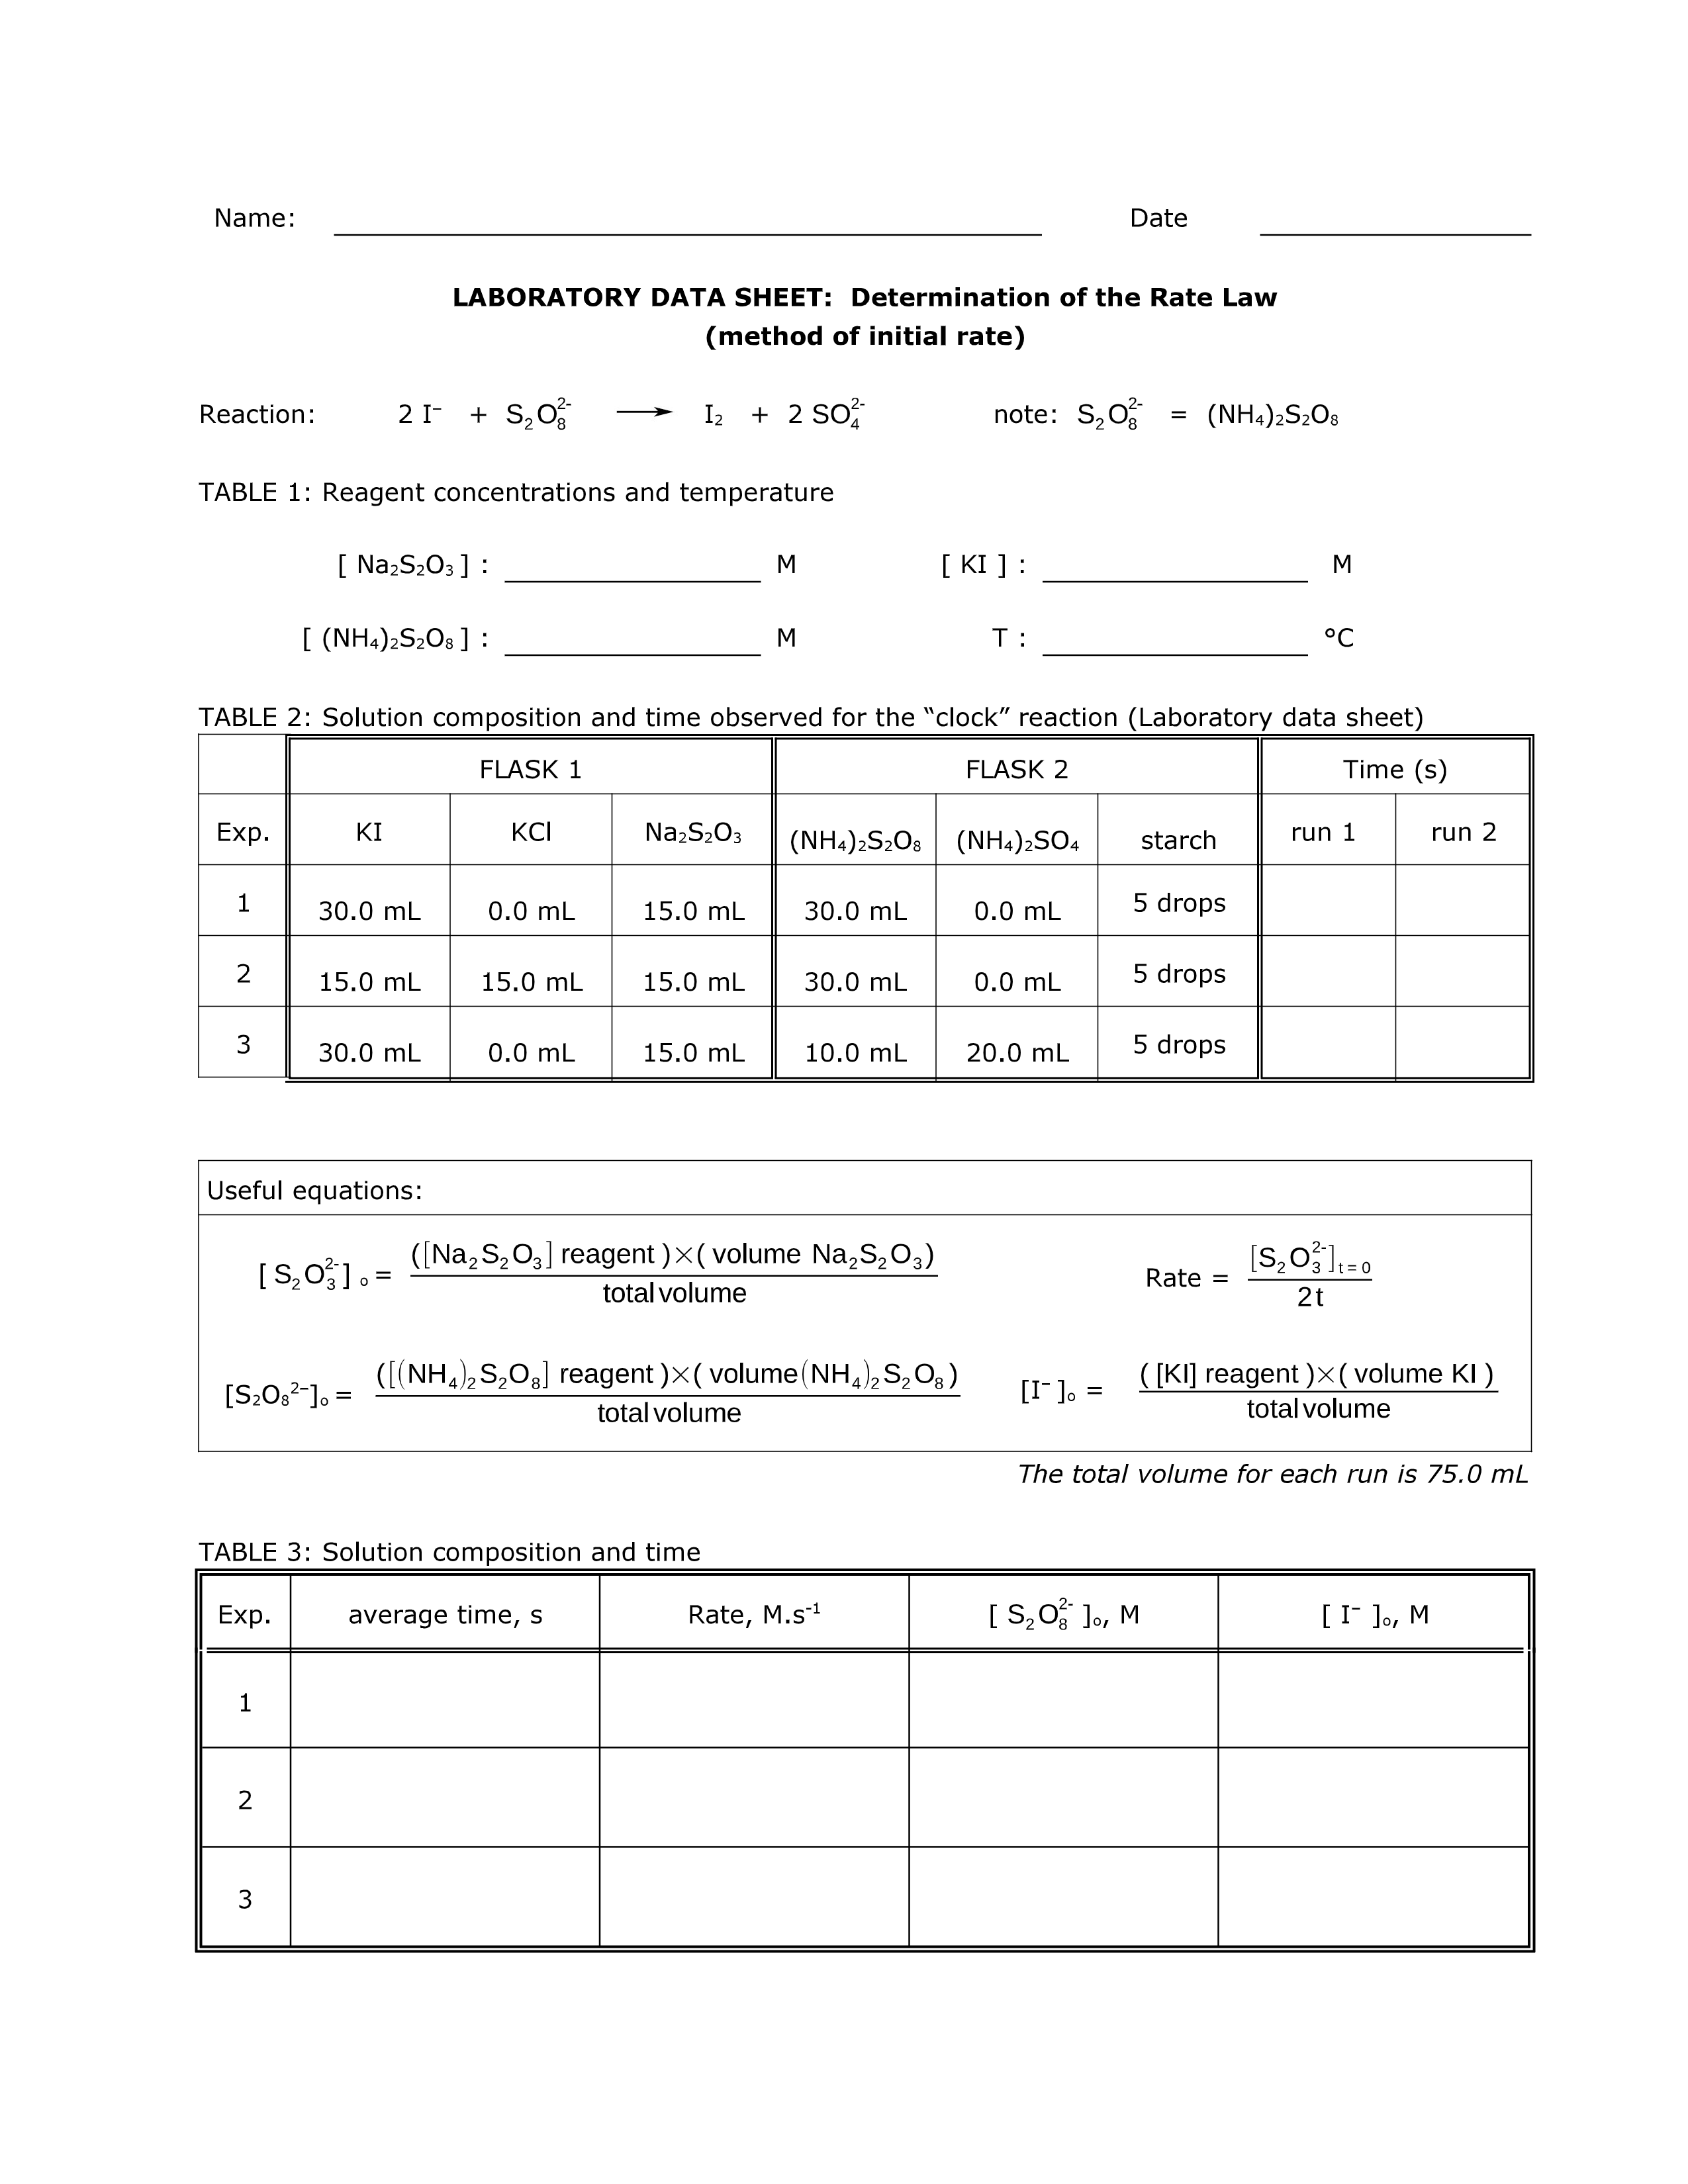
- Balanced chemical equation
Therefore, use your rate law data sheet (already filled) as your cover page.
Data & results
Since your "Rate law" data sheet is your cover sheet, you don't need to type or write a new table, however, it must completely be filled. Also your data recorded in the laboratory must be filled in ink (with my signature). Any missing information will result in a penalty of 0.5 points.
Sample calculations
Perform all your calculations on the "boxes" of the template provided
(click here).
All your calculations must fit on this single page.
There is no need to type them and a pencil can be used.
The correct use of significant figures must be respected for the final answer, with units.
Answer to questions
There is no question to answer for the rate law lab. Therefore, do not submit any pre-lab or post-lab question
The activation energy
For this part of the lab report, 4 pages must be submitted:
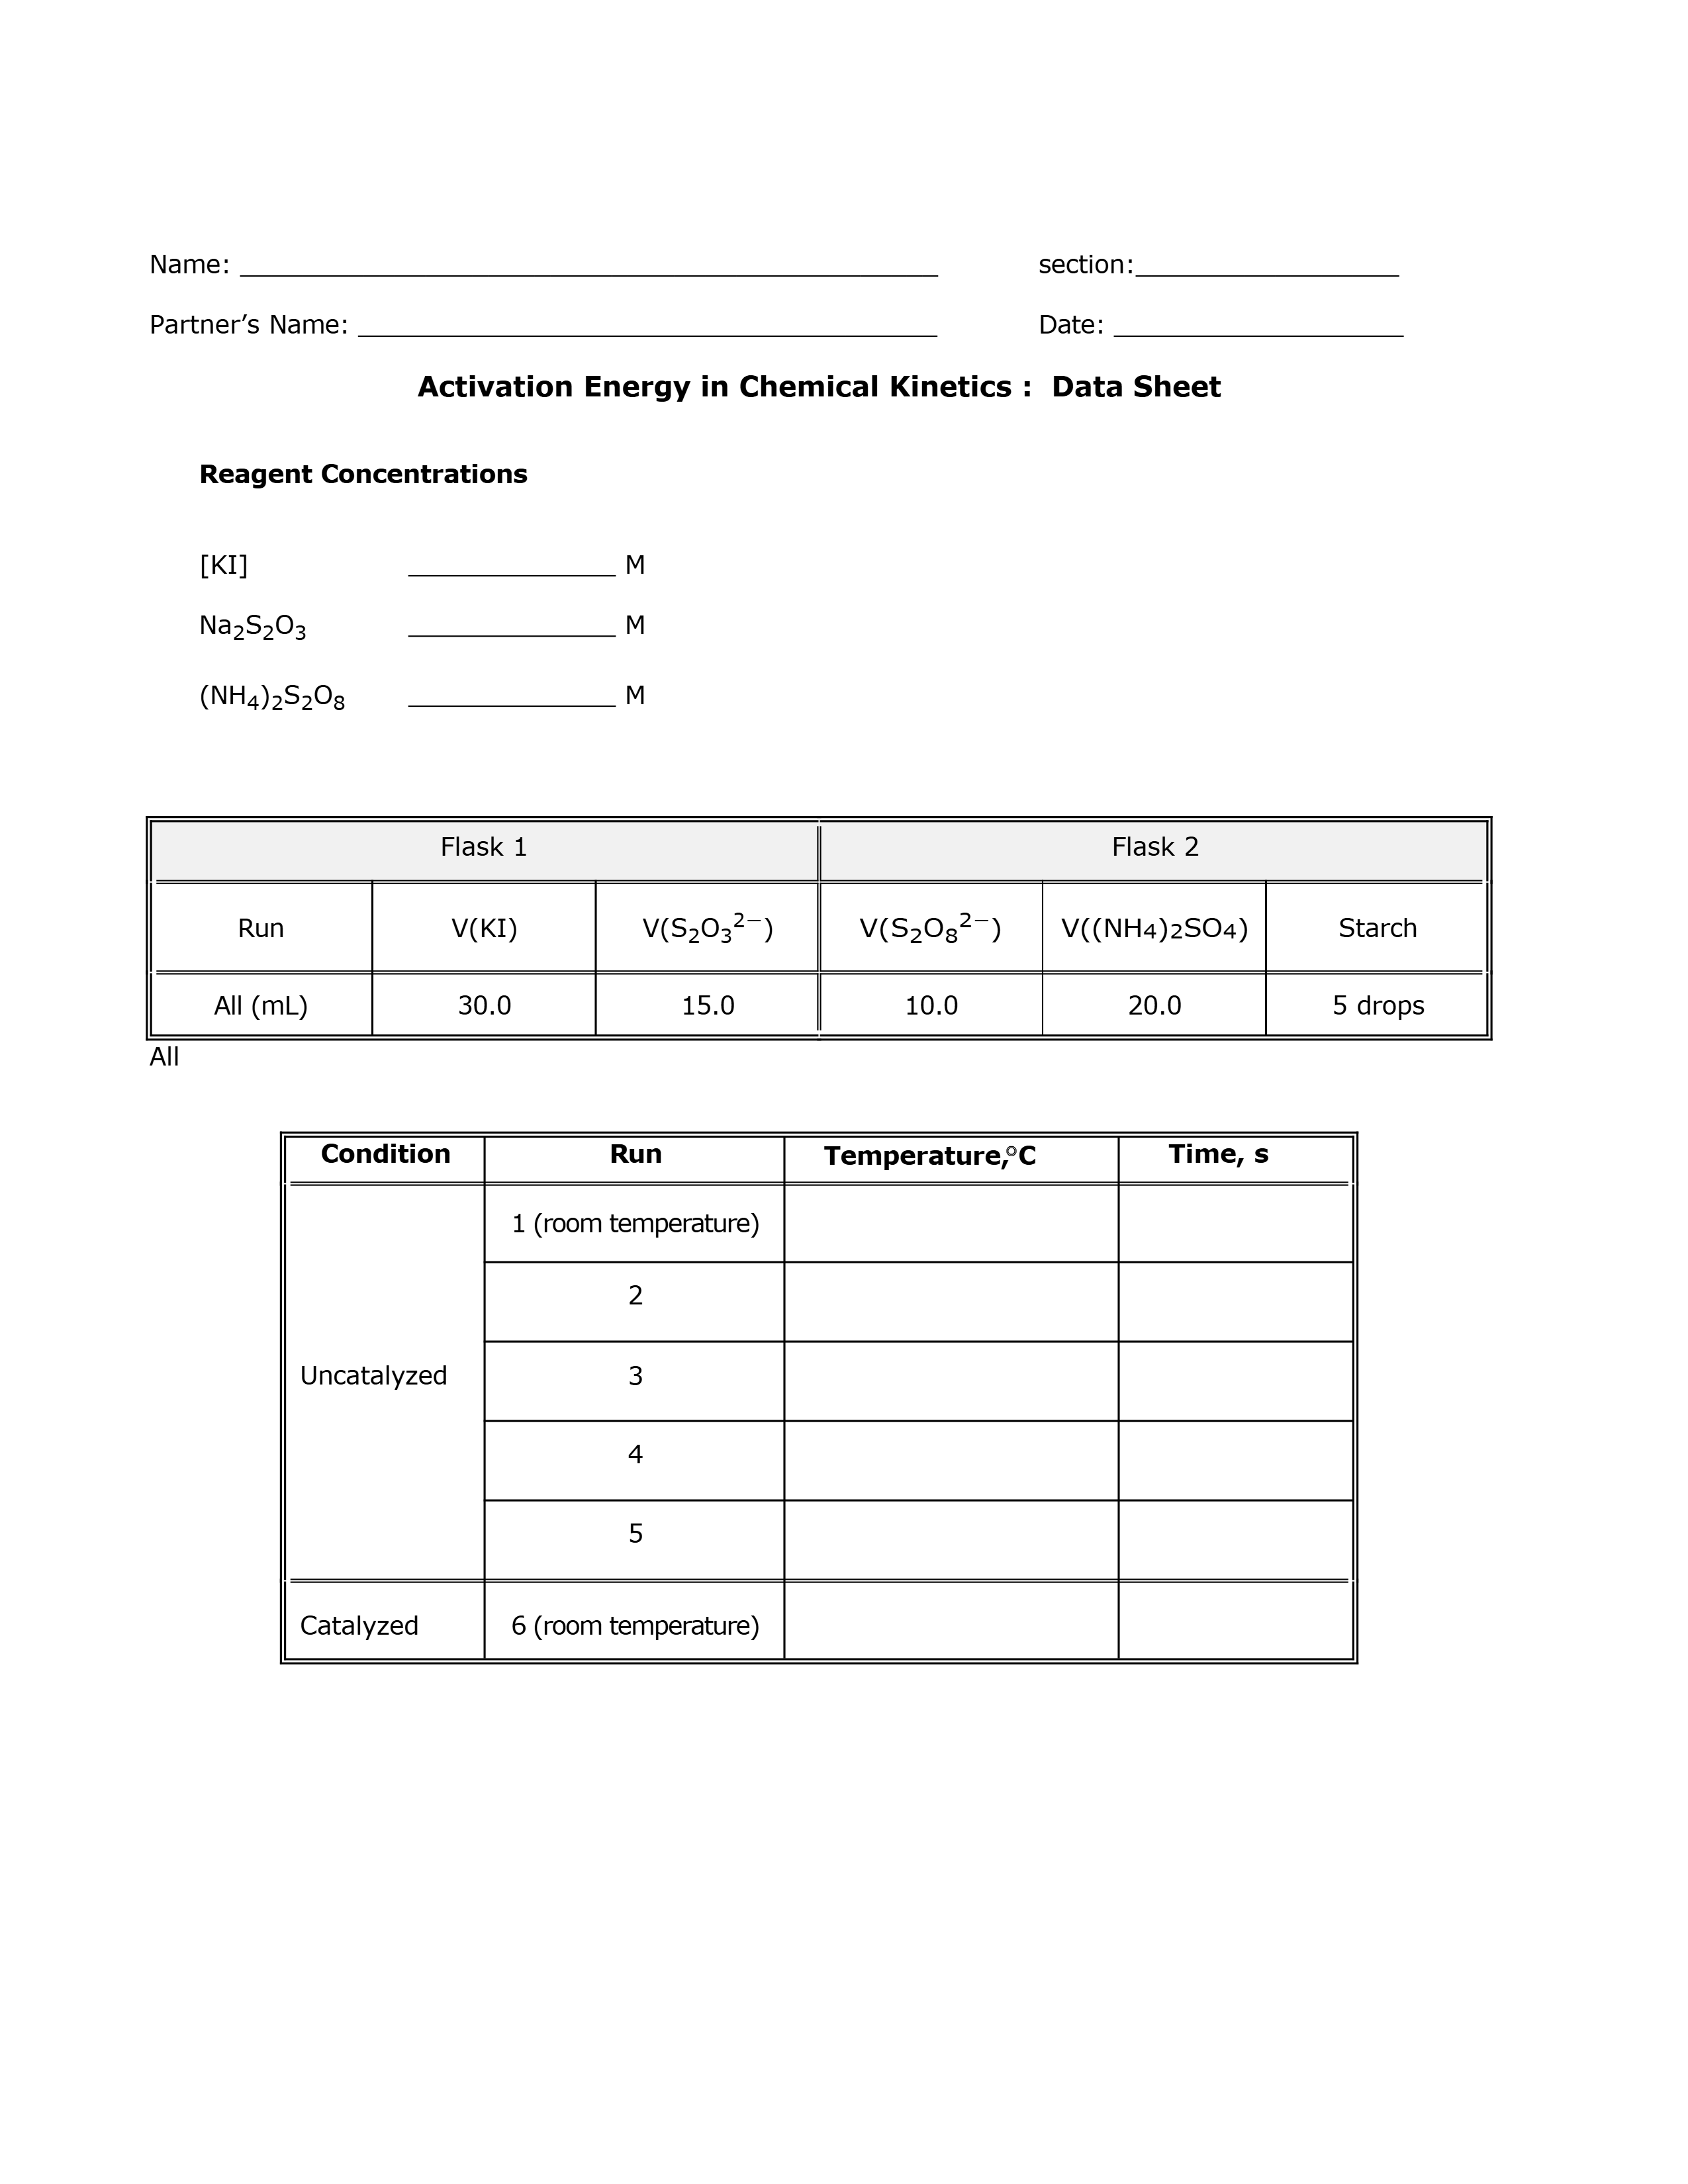
- Your laboratory data sheet (teacher's signed)
- Table of results (calculation)
- Graph for the determination of the activation energy (Ea)
- Answer to the questions
Your laboratory data sheet is the one signed by the teacher in the lab. No need to type your data, use this sheet as your page of data.
Table of result: Download and complete this template. The rate calculations are similar to those in the "Rate Law" lab, so you do not need to detail your calculations. Use the concentration of the species for the 75 mL solution indicated on this template to perform your calculations.
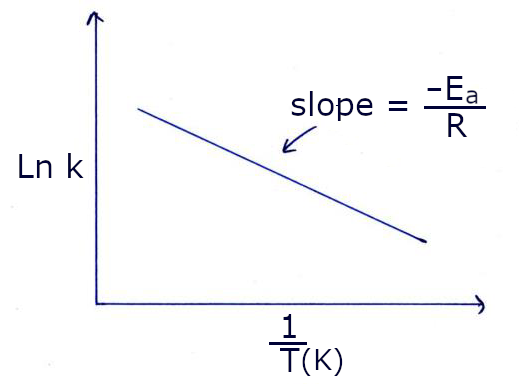
Graph for the determination of Ea: You need to make a graph based on the linear form of the Arrhenius equation.
).
It can be made with Excel or with a simple online application like Linear regression calculator.
Write the slope equation on the graph and use it to calculate Ea
Give an appropriate title to your graph such as: "Arrhenius Diagram" or "Ea Determination Graph".
Enter the value of Ea in the table of results with the correct number of significant figures.
Hint: the number of S.F. is limited by the least precise concentration used in this experiment.
Finally, at the back of the Table of data, calculate the ratio: k(catalized)/k(uncatalized)
LABORATORy QUESTIONS: Rate law and Activation energy
No need to answer the pre-lab and post-lab questions of the lab manual.Only answer the following question and submit these with your report (last page)